Visibility Isn't Liquid
Why most C7 Z06 listings aren't actually participating in the market

From Visibility to Reality
The C7 Z06 market is easy to track. Inventory is building, listings are easy to find, and pricing appears consistent across the market.
But tracking the market is not the same as understanding it, and most listings aren’t progressing. Over 70% of listings have made one price change or less.
Nearly 50% of automatic listings haven’t moved at all.
This is not a pricing problem. It’s a participation problem.
At the median, pricing hasn’t meaningfully shifted. Median net price change is -1.91%, and automatic listings show no movement (0.00%).
The market is easy to observe, but much harder to engage.
A Slower Market Doesn’t Mean a Static One
The C7 Z06 is no longer the current generation. That matters.
As enthusiast markets move past their production cycle, buyer urgency typically declines. Inventory expands. Transactions become more selective.
That shift is normal. But slower does not mean inactive. In a typical prior-generation market, listings still adjust. Sellers respond to conditions. Prices move toward clearing levels over time.
That’s not what we’re seeing here. Most listings are not just slow.
They are static.
The market has transitioned.
Most sellers haven’t adjusted with it.
Week 7 — Market Snapshot
Active Listings: 133 (↑ from 121)
Median Price: $71,999 (↑)
Manual Median: $73,150
Auto Median: $71,991
Manual Premium: 1.6% (↓)
Median Weeks Active: 2.71 (↑)
Avg Weeks Active: 3.78 (↑)
Inventory Turnover: 20.3%
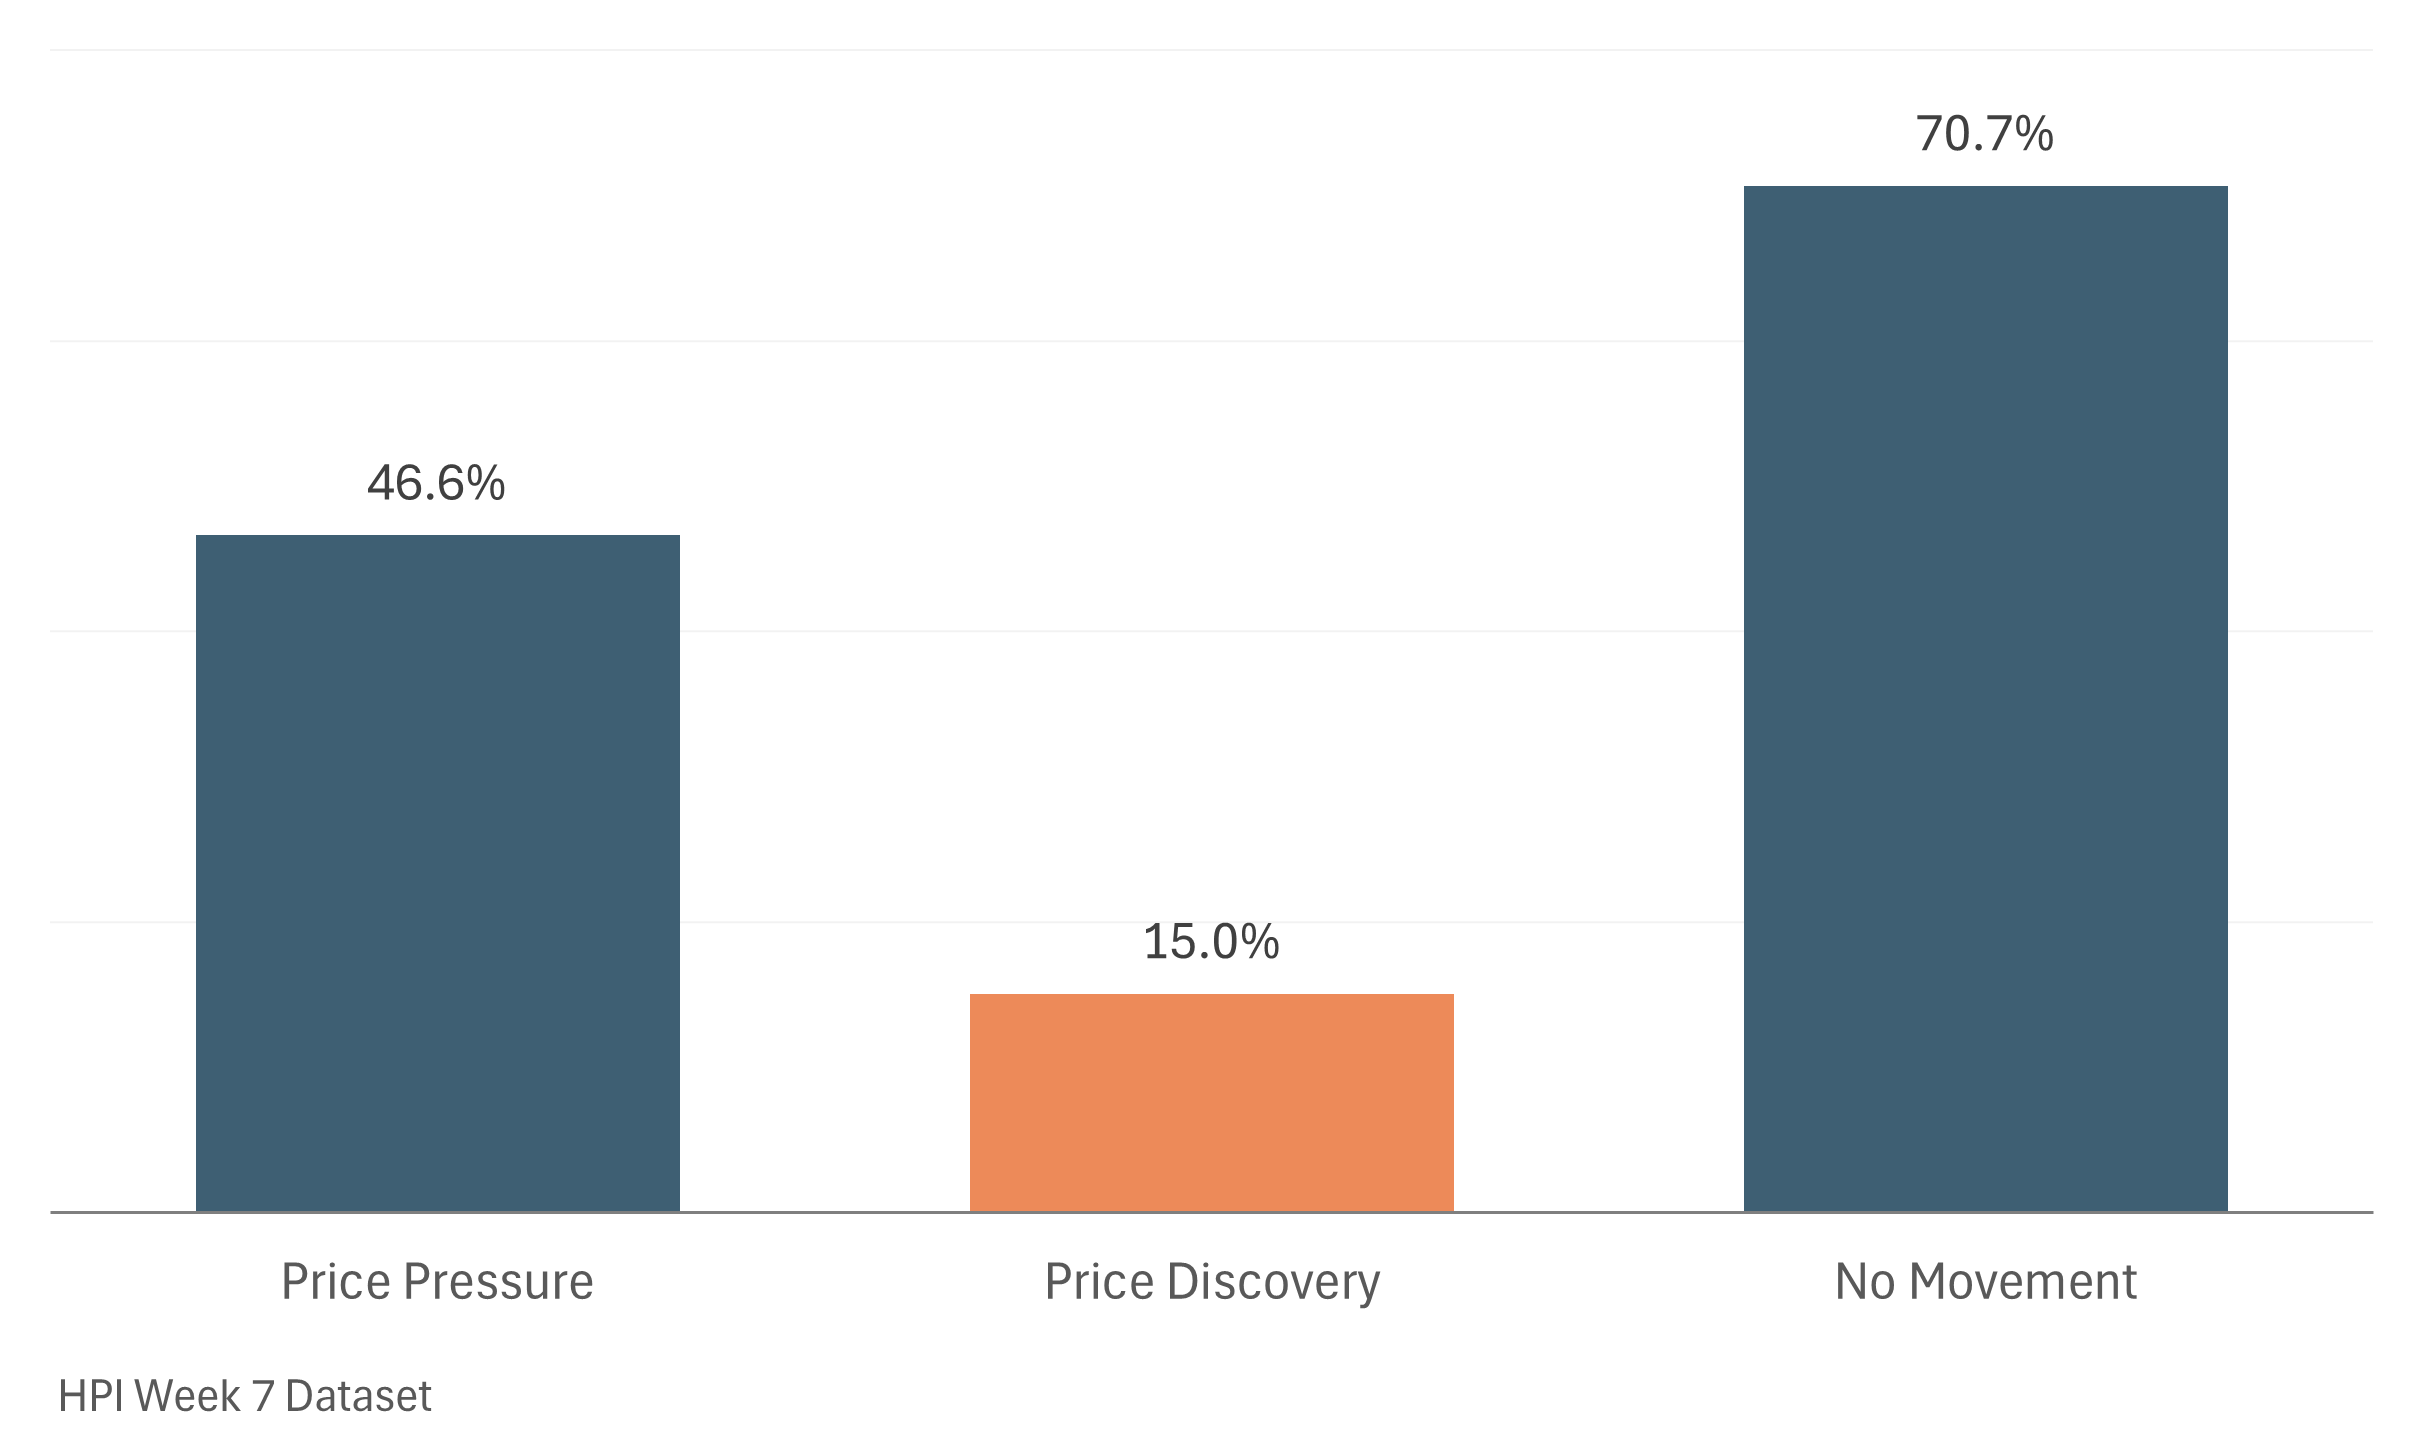
Discount Pressure Index: 46.6%
Discovery Rate: 15.0%
Market coverage is expanding. Listings are aging.
And most sellers aren’t moving.
The Illusion of Activity
An increase in listings does not automatically translate into market movement. What looks like activity is often just accumulation.
The majority of listings show little to no progression:
~70% of listings have ≤1 price change
~50% of automatic listings have 0 price changes
That’s not a market in motion.
It’s a market holding position.
Figure 1 — C7 Z06 Dealer Activity
(Horizon Performance Index - Week 7 Dataset)
Listings are present. Pricing is visible. But without change, there is no progression toward a transaction.
The pattern shows up clearly when you look at individual listings.
HPI-0010
2019 · Auto 2LZ · ~23k miles · Performance Video and Data Recorder
Weeks Active: 5.86
Price Changes: 0
Net Change: 0.0%
This listing has been on the market for nearly six weeks with no price movement. It’s a clean, late-model example positioned within the market. Nothing about the asset explains the lack of activity.
This is visibility without participation.
There has simply been no progression.
HPI-0047
2016 · Auto 3LZ · ~17k miles
Weeks Active: 5.86
Price Changes: 0
Net Change: 0.0%
Even higher-spec inventory shows the same pattern.
Low mileage. Strong configuration. Fully visible in the market.
No movement.
Time has passed — nothing else has.
What Time Actually Tells You
Days on market is often interpreted as leverage.
The assumption is simple: the longer a listing sits, the more flexible the seller becomes. In practice, that only holds when behavior changes. A listing that remains static over time is not becoming more attractive. It is simply being shown to more buyers at the same price. Time without adjustment does not create opportunity.
It creates exposure, not opportunity.
Median Weeks Active continues to rise:
Week 5: 1.57
Week 6: 2.43
Week 7: 2.71
Listings are aging. But without meaningful price movement, that aging does not translate into progress. Days on market is not a countdown.
It is a filter.
Turnover Tells the Truth
Listings show what is available. Turnover shows what is actually happening.
Weekly turnover:
Week 5: 20.2%
Week 6: 14.9%
Week 7: 20.3%
Inventory is cycling, but not at a rate that reflects the volume of active listings.
At the same time, cumulative turnover continues to increase:
Week 5: 64.5%
Week 6: 72.1%
Week 7: 85.0%
Over time, the market does clear. But that clearing is uneven and inconsistent.
Liquidity exists, but it is concentrated in a small portion of listings.
What Actually Creates Liquidity
Listings that transact tend to follow a consistent pattern.
They begin with a meaningful initial price adjustment, followed by continued follow-through, and ultimately align with buyer expectations. That progression is what moves a listing from visibility into a transaction.
Most listings never make that transition.
They remain unchanged, waiting for conditions to shift around them rather than adjusting to the market themselves. Over time, that lack of movement becomes the defining difference between listings that clear and those that remain available.
That difference is what defines the market.
Why the Market Feels Active
The market feels active because it is constantly updating:
new inventory
refreshed listings
visible pricing
But most of those listings are not advancing. They are static entries in a dynamic feed. This creates the appearance of movement without the underlying behavior required to support it. In other words, visibility increases.
Participation does not.
What This Means
The current market dynamic is not driven by pricing alone. It is driven by whether sellers are willing to adjust to current conditions.
A large portion of listings show early signs of pressure. Only a small portion translate that pressure into action.
That separation is what determines which listings move and which remain available.
The Buyer Advantage
The traditional approach is to focus on listings that have been on the market the longest, assuming time creates leverage. In this market, that assumption breaks down quickly. Most listings are not becoming more negotiable over time. They are simply being seen more often at the same price.
The advantage is not finding older listings.
It is identifying which listing are actually progressing.
Listings that begin to move, through meaningful reductions and continued follow-through, signal a seller who is participating in the market. That participation is what creates real opportunity.
Everything else is static inventory.
There is where HPI creates separation. By focusing on behavior rather than visibility, buyers can distinguish between listings that are likely to transact and those that are simply present.
The opportunity is not where the listings are.
It is where the movement begins.
What We’re Watching
As inventory continues to build and narratives shift toward the next model cycle, HPI remains focused on behavior rather than speculation.
The key question is not whether pressure exists, but whether it converts.
We are tracking how often sellers move beyond initial reductions and into sustained price discovery, how frequently those moves lead to resolution, and how long it takes for listings that do engage to clear. Time-to-sale, concession rates, and the consistency of follow-through all become more important as inventory expands.
Early signals from Week 7 point in a consistent direction. The market is growing, but participation is not keeping pace. Sellers are adjusting selectively, not broadly, and that gap continues to define how liquidity is distributed.
If the market shifts, it will not show up in listing volume or pricing first.
It will show up in behavior.
Conclusion
The market is not difficult to read, but it is easy to misinterpret.
Listings provide visibility. They show what is available and where sellers are positioned. Time adds context, helping frame how long those positions have held.
But neither visibility nor time creates outcomes on its own.
Movement comes from action.
The difference between listings that clear and those that remain available is not price alone, and it is not time on market. It is whether sellers are willing to adjust and follow through.
That is what HPI is designed to capture.
Not just where listings are, but what they are doing.
Because that is where the signal is.